Question 1
What does endogenous mean, in words? What about statistically?
Question 2
If a regression is biased (from endogeneity), what can we learn about the bias?
Question 3
What does heteroskedasticity mean? Does heteroskedasticity bias \(\hat{\beta_1}\)?
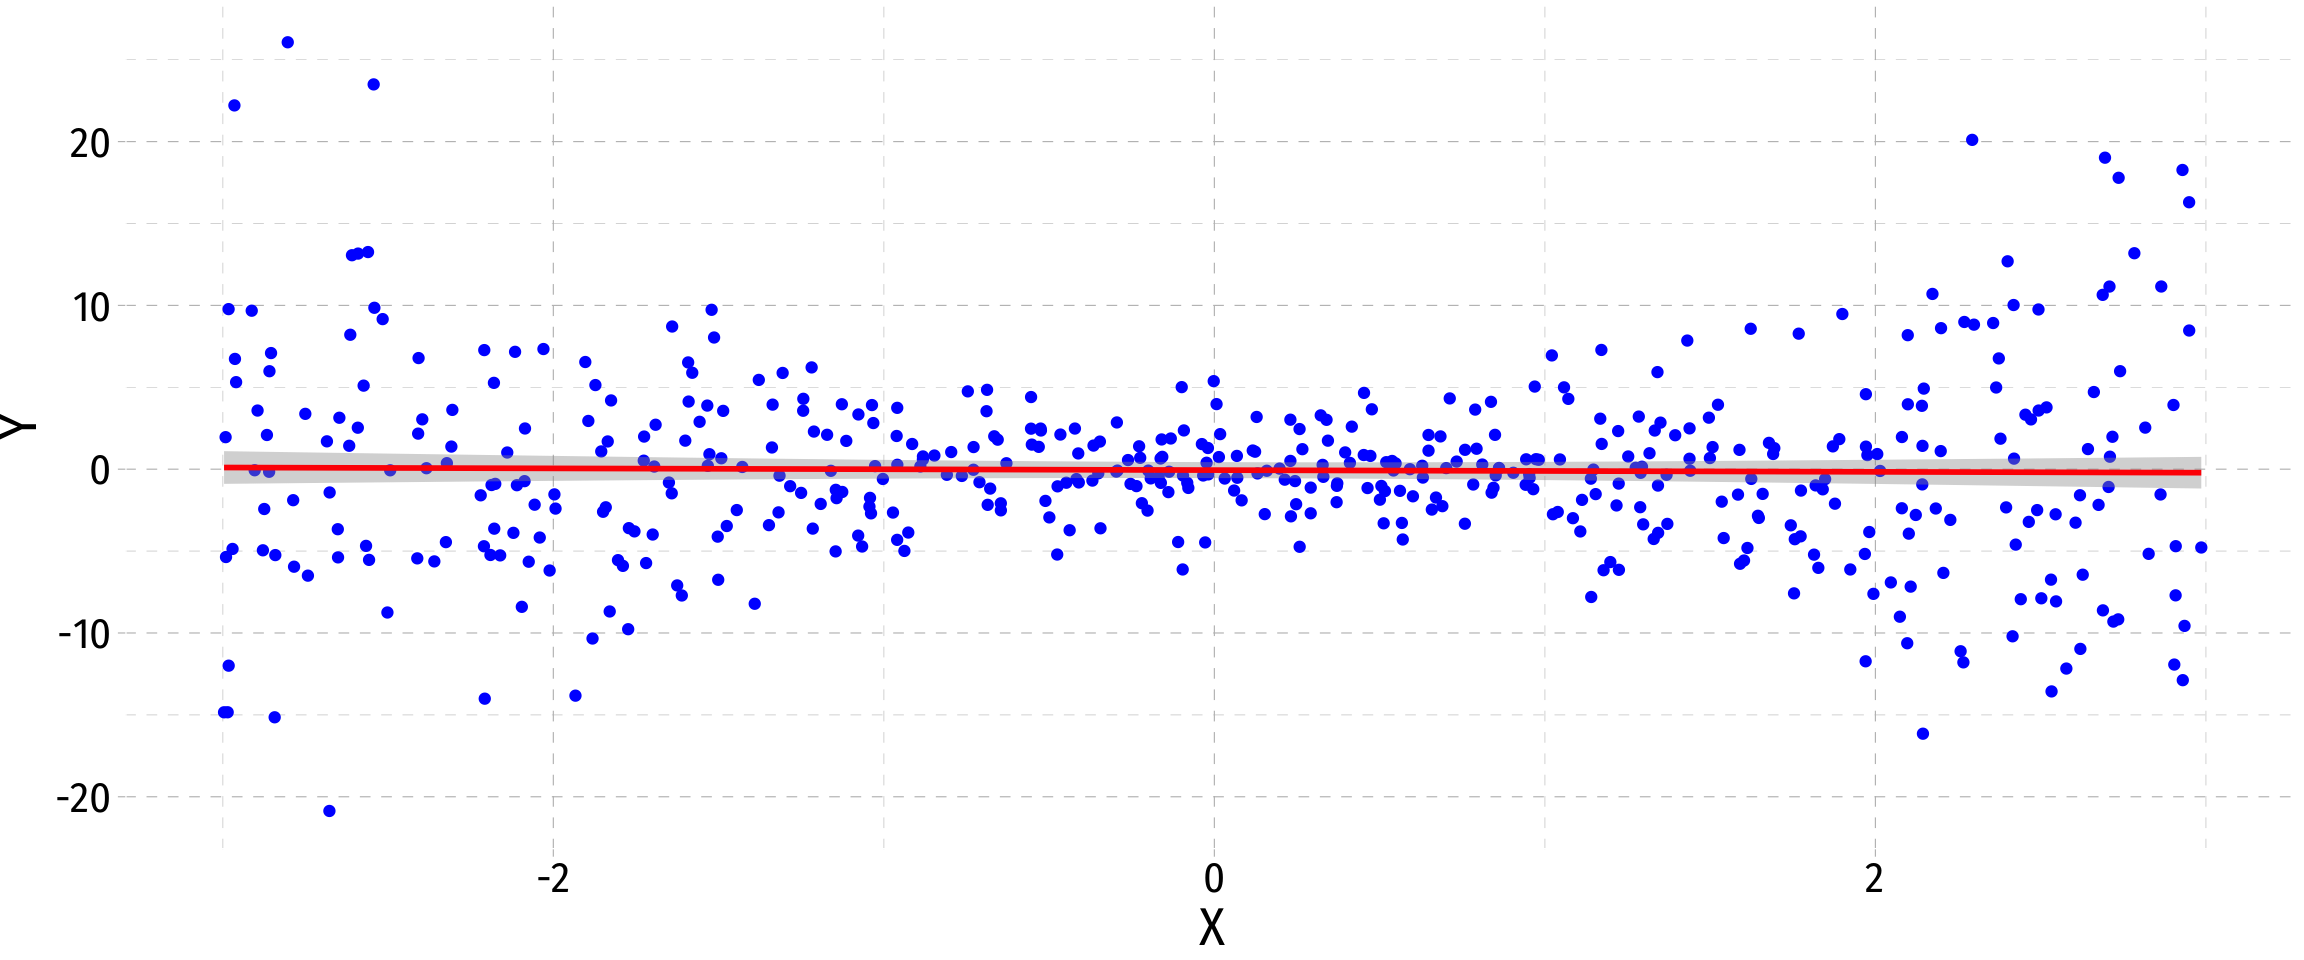
Question 4
Is this data likely heteroskedastic or homoskedastic?
![]()
Question 5
What three things impact the variation of \(\hat{\beta_1}\)? How?
Question 6
What are the four assumptions we make about the error term?
Question 7
\[Wages_i=\beta_0+\beta_1Education+u_i\]
- Is \(\hat{\beta_1}\) likely biased?
Question 8
What does \(R^2\) measure? What does it mean? How do we calculate it?
Question 9
What does \(\sigma_u\) (SER) measure? What does it mean?
Question 10
Interpret all of these numbers (except Adjusted R-squared and the last line):
Call:
lm(formula = y ~ x, data = het_data)

Residuals:
     Min       1Q   Median       3Q      Max
-20.9518  -2.6972  -0.1055   2.4352  25.9720

Coefficients:
            Estimate Std. Error t value Pr(>|t|)
(Intercept) -0.05633    0.24844  -0.227    0.821
x           -0.05289    0.14502  -0.365    0.715

Residual standard error: 5.552 on 498 degrees of freedom
Multiple R-squared:  0.0002671, Adjusted R-squared:  -0.00174
F-statistic: 0.133 on 1 and 498 DF,  p-value: 0.7155
Question 11
Interpret all of these numbers:
| |
y |
| Constant |
−0.06 |
| |
(0.25) |
| x |
−0.05 |
| |
(0.15) |
| n |
500 |
| R2 |
0.00 |
| SER |
5.54 |
|
* p < 0.1, ** p < 0.05, *** p < 0.01 |
Question 12
Suppose \(Y\) is normally distributed with a mean of 10 and a standard error of 5. What is the probability that \(Y\) is between 5 and 15?
Question 13
Explain what a \(Z\)-score means.
Question 14
Explain what a \(p\)-value means.
Question 15
We run the following hypothesis test at \(\alpha=0.05\):
\[\begin{align*}
H_0: \, & \beta_1=0\\
H_1: \, & \beta_1 \neq 0 \\
\end{align*}\]
Is this test one-sided or two-sided?
We find the \(p\)-value is 0.02. What is our conclusion? Be specific and precise in your wording!
Question 16
Suppose we ran that hypothesis test on our finding. What can we conclude?
Call:
lm(formula = y ~ x, data = het_data)

Residuals:
     Min       1Q   Median       3Q      Max
-20.9518  -2.6972  -0.1055   2.4352  25.9720

Coefficients:
            Estimate Std. Error t value Pr(>|t|)
(Intercept) -0.05633    0.24844  -0.227    0.821
x           -0.05289    0.14502  -0.365    0.715

Residual standard error: 5.552 on 498 degrees of freedom
Multiple R-squared:  0.0002671, Adjusted R-squared:  -0.00174
F-statistic: 0.133 on 1 and 498 DF,  p-value: 0.7155
| |
y |
| Constant |
−0.06 |
| |
(0.25) |
| x |
−0.05 |
| |
(0.15) |
| n |
500 |
| R2 |
0.00 |
| SER |
5.54 |
|
* p < 0.1, ** p < 0.05, *** p < 0.01 |